| Details | |
|---|---|
Due date |
2019-01-09 (file upload) |
Format |
File upload |
Pages |
- |
Submission |
via github |
Filename |
see details |
Data |
Raw data from HOBO logger |
Challanges |
Create a consistent HOBO data file with header |
1. Aim
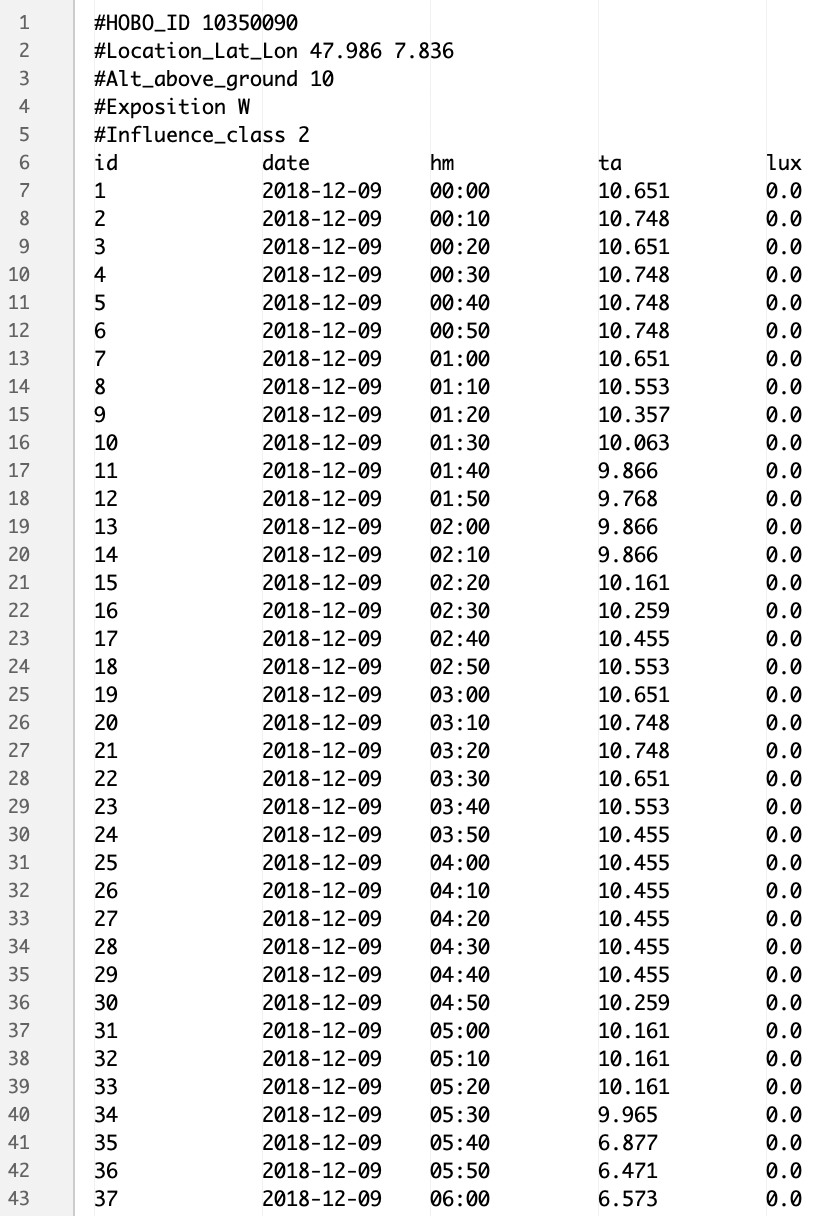
Aim of this exercises is to generate a consistent version of your HOBO data. At the end of this exercise all HOBO files should look the same. The single files should be uploaded at the end of the exercise to make the data available for all students. All HOBO files can then be found in one Github directory.
Report: This is mainly about uploading a clean version of your HOBO data that should have the described format. It is sufficient to describe this in 2-3 sentences in your exercise report.
2. Preparation
2.1 File format
The HOBO data file should be provided as a text file. Columns should be tabulator-separated (tsv-format), use a point (.) as decimal separator. The file name has to be “your_hobo_id.tsv” (e.g. 10305099.tsv). The ID should match the ID in the HOBO meta table.
2.2 Data format
There should be five header lines. Header lines start with a ‘#’ and a keyword.
1. Your HOBO_ID.
2. Location of your HOBO with 3 decimals
3. Altitude above ground (in meters, no decimals)
4. Exposition (N,E,S,W)
5. Influence class (0=no, 1=low, 2=moderate, 3=high, 4=very high)
Line 6 are the column descriptors with:
1. id = running number for each measurement
2. date = date in YYYY-MM-DD
3. hm = time in HH:MM (hours and minutes, no seconds)
4. ta = measured air temperature (°C)
5. lux = measured light intensity (Lux)
From Line 7 on there should be the HOBO data, i.e. values for air temperature and light intensity (10-minute values). Use here the raw data from the HOBO sensor and neither change the decimal places nor round the numbers or change the data values etc.

2.3 Adjustment of data series
Periods with indoor or other conspicuous measurements could be remove manually. For example, the logger has measured air temperature and light intensity shortly before you read out the data. Hence, the last few data points in the series could be removed. Remove special characters like punctuation marks, or unintended blanks/whitespaces and tabstops. Ideally you use a text editor that shows invisbile symbols (e.g. tabstops)…
It is recommended to adjust the time series to included only full days (24 hours with 144 x 10-minute measurements). Ideally your data series cover the period 2019-12-14 00:00 until 2020-01-06 23:50. No worries, if your data series is shorter, this is not a problem (i.e. if your logger has a measurement failure due to low battery etc.).
Fill missing values with NA (non available data points).

Please check that you are able to load the prepared HOBO data file into R with e.g. read.table, fread, read_tsv and compare how fast the data is imported with different functions/packages. Why? Check the rio-package and read about its import and export functions. If you want you can try to import the HOBO data and export it into an Excel-file (*.xls).
Use skip=... to avoid that the header information is considered as data lines.
3. Upload your file
Prepare your HOBO data file as described above and upload the new raw data file.

If you have no push access for that repository check your e-mails for an invitation link to the github team or ask the teacher(s) to help.
Use the right file name (see above) and double-check your header information (compare to the Figure above)!!! Double check typos like blanks, lower/upper case, column names etc. Use an text editor that shows invisible characters like blanks, tabstops or linebreaks to ensure you have a tab-separated file.
That’s it.