1. Load the HOBO meta file into R
Load library(tidyverse).
We can use the link given in the github repository overview on https://github.com/data-hydenv/_overview and put following code snippet into R.
data <- read_csv("https://docs.google.com/spreadsheets/d/e/2PACX-1vS_m42YZdulaKJVngJZq51T5CEX36LlqkAnHzOoVmcZXpbHGZ_AofTknbrPGRfWS5PRQ9GygOgkEHdz/pub?output=csv", col_types  = cols())

meta <- data %>%
        as_tibble() %>%
        select(-name_anonym, -description)
2. First view on meta table
meta
# A tibble: 43 x 9
      id hobo_id data_available region latitude longitude exposition
   <dbl>   <dbl> <chr>          <chr>     <dbl>     <dbl> <chr>
 1     1  1.08e7 yes            Freib…     48.0      7.83 W
 2     2  1.03e7 yes            Freib…     48.0      7.82 S
 3     3  1.08e7 no             Freib…     48.0      7.86 E
 4     4  1.04e7 yes            Freib…     48.0      7.87 N
 5     5  1.03e7 yes            Freib…     48.0      7.84 S
 6     6  1.04e7 yes            Freib…     48.0      7.86 N
 7     7  1.04e7 yes            Freib…     48.0      7.84 N
 8     8  1.04e7 yes            Freib…     48.0      7.89 S
 9     9  1.04e7 yes            Freib…     48.0      7.81 N
10    10  1.03e7 yes            Freib…     48.0      7.81 E
# … with 33 more rows, and 2 more variables: altitude <dbl>,
#   influence <chr>
head(meta) %>% as.data.frame()
  id  hobo_id data_available   region latitude longitude exposition
1  1 10760706            yes Freiburg   47.975    7.8260          W
2  2 10347531            yes Freiburg   48.007    7.8212          S
3  3 10760815             no Freiburg   48.014    7.8573          E
4  4 10350086            yes Freiburg   47.991    7.8717          N
5  5 10347319            yes Freiburg   47.985    7.8360          S
6  6 10350043            yes Freiburg   47.990    7.8629          N
  altitude influence
1        5       low
2       10  moderate
3        3       low
4        3  moderate
5       16       low
6        6  moderate
meta %>% count(exposition, sort = TRUE)
# A tibble: 4 x 2
  exposition     n
  <chr>      <int>
1 E             16
2 N             11
3 W              9
4 S              7
meta %>% count(influence, sort = TRUE) %>%
    mutate(relative = n / sum(n))
# A tibble: 4 x 3
  influence     n relative
  <chr>     <int>    <dbl>
1 low          21   0.488
2 moderate     15   0.349
3 high          6   0.140
4 very high     1   0.0233
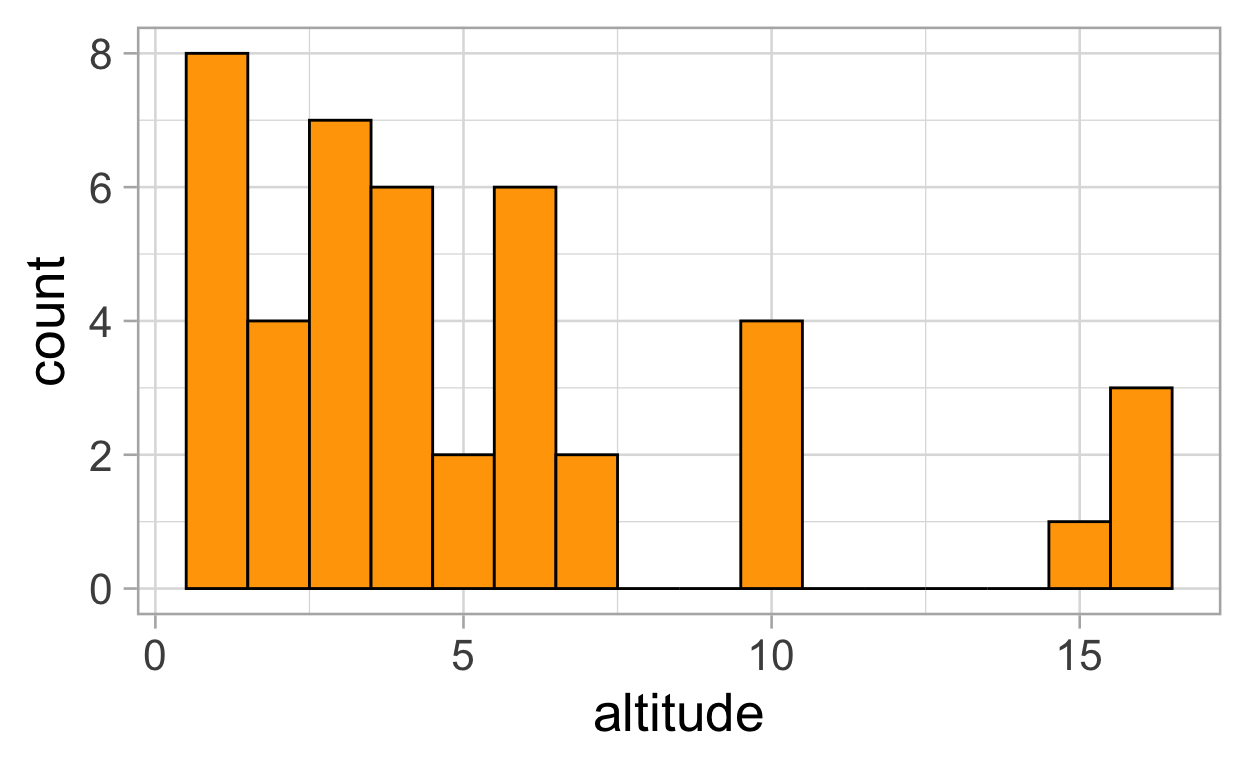
ggplot(data = meta  , aes(x = altitude)) +
    geom_histogram(binwidth = 1, fill = "orange", colour = "black")+
    theme_light(20)
3. Accessing the index sheet
index <- read_csv("https://docs.google.com/spreadsheets/d/e/2PACX-1vS_m42YZdulaKJVngJZq51T5CEX36LlqkAnHzOoVmcZXpbHGZ_AofTknbrPGRfWS5PRQ9GygOgkEHdz/pub?gid=58660777&single=true&output=csv", col_types  = cols())

index %>% select(hobo, t_avg, t_fl, f_na, l_md)
# A tibble: 44 x 5
       hobo t_avg   t_fl   f_na    l_md
      <dbl> <dbl>  <dbl>  <dbl>   <dbl>
 1 10760706  5.89  0.525  0.016  1135.
 2 10347531  8.76  0.453  0.021  4964.
 3 10760815 NA    NA     NA        NA
 4 10350086  6.56  0.368  0        90.3
 5 10347319  7.65  0.455  0.013   442.
 6 10350043  5.83  0.474  0.141   832.
 7 10350009  6.72  0.411  0.019  1592.
 8 10350048  5.68  0.559  0.172 17495.
 9 10350051 NA    NA     NA        NA
10 10347346  6.17  0.362  0.125  6201.
# … with 34 more rows
For example, then investigating relationships between the indices with a correlation matrix (here from corrr package).
library(corrr)
correlate(index) %>% rplot(shape = 16,
                colors = c("magenta","white" ,"blue"))
index %>%
    pivot_longer(cols = t_avg:l_95) %>%
    ggplot(data = ., aes(x = name, y = value))+
    geom_boxplot(aes(group=name))+
    facet_wrap(~name, scales = "free", nrow = 2)